Reiware Shader Graph: Building Shaders in the Browser
A look at Reiware Shader Graph - a browser-based node editor for building, previewing, and experimenting with shaders directly inside interactive tutorials.

On this page⌄
Introducing Reiware Shader Graph
A browser-based shader editor for interactive tutorials, reusable examples, and quick experiments.
Shader tutorials are usually pretty static. You get a screenshot of a graph, a few cropped images of individual nodes, and then try to reconstruct the whole thing yourself.
Reiware Shader Graph takes a different approach: the graph lives inside the article, so you can inspect the connections, change a value and see the result without leaving the lesson.
This is an experimental learning tool rather than a replacement for Unity Shader Graph. It focuses on a small, understandable loop: add a node, connect it, change a value and understand what happened.
Your first shader in five minutes
Start with the smallest graph that produces visible motion. Open the editor, create a Lit graph and add a Time node, a Sine node, a Multiply node and a Fragment output.
Connect the nodes in this order. The Time value changes every frame, Sine remaps it into a smooth range, and Multiply gives you a control over the animation speed or brightness.
Time → Sine → Multiply → FragmentSet Multiply to around 2.0, connect the result to Fragment Base Color, and switch the preview mesh to a sphere. You should see a soft animated pulse. Change the multiplier to 0.5 and 5.0 to feel the difference between a slow and fast signal.
Once this works, add a Color node and multiply it with the animated value. That is the basic pattern behind many of the more interesting examples: one signal, one shaping operation and one visible material property.
Simple Animation Shader Graph
Editable starter graph: change the speed, color or output and watch the preview respond.
The editor
The editor is split into a graph canvas, node library, realtime preview, inspector and toolbar. The canvas is where the material is assembled; the preview is where you verify the result; the inspector exposes the selected node values.
Nodes can be added from the library, moved freely and connected through typed input and output handles. Values update directly in the node, so the feedback loop stays close to the graph instead of being hidden in a separate panel.
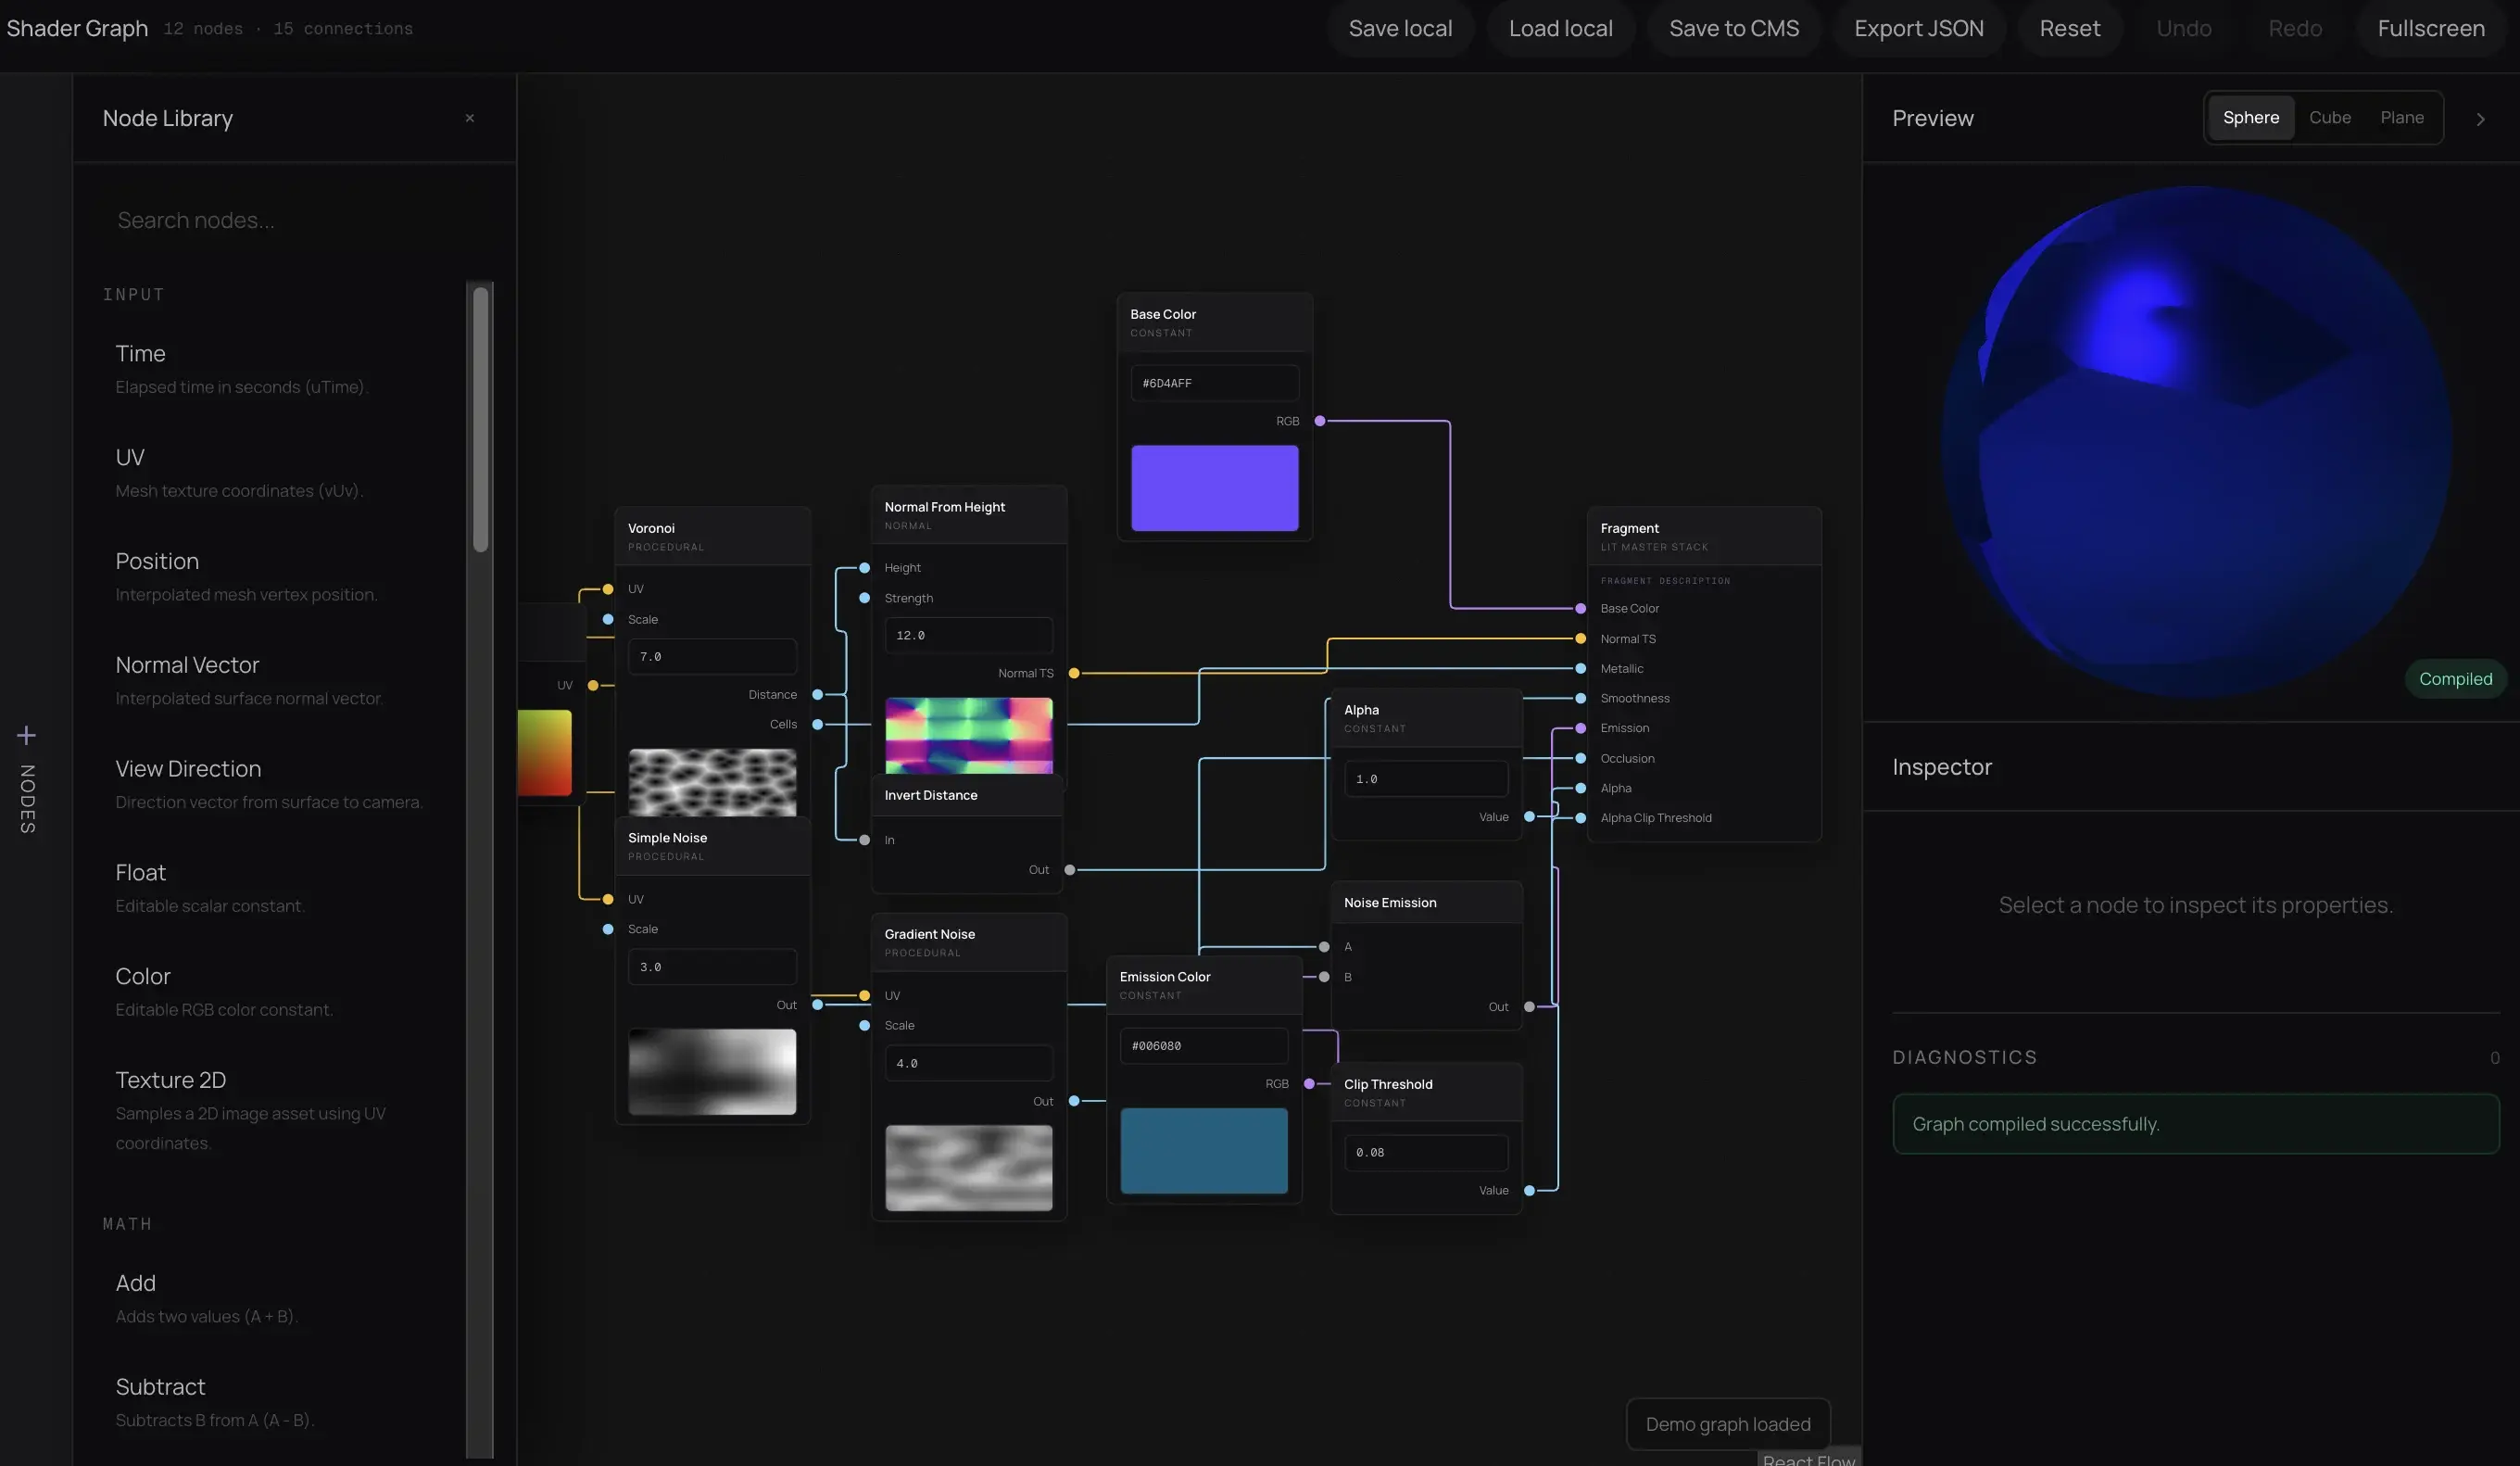
The current library includes input nodes such as Time, UV, Float and Color, common math operations, Fresnel, procedural noise, vector utilities and Lit/Unlit Fragment outputs.
Building a graph
A useful graph usually has three layers: coordinates or signals, shaping and math, then material output. Keep those layers flowing in one direction and group related nodes together. Readability matters more than saving a few pixels of canvas space.
Typed sockets and one output
Every socket has a type such as float, vector or color. The editor checks compatibility before accepting an edge, which catches mistakes early. A graph also has one Fragment output: it is the material contract, with inputs that change depending on Lit or Unlit mode.
Working with connections
Create a connection by dragging from an output handle to a compatible input. To replace a connection, drag a new edge onto the input; to remove one, detach the edge or use the node controls. Reroute nodes do not change the generated shader, but they keep larger graphs readable.
Realtime preview
Graph changes are reflected in the preview, while uniform values such as colors and floats update independently so sliders stay responsive. Use a sphere to read Fresnel and lighting, a plane for UV and texture work, and a capsule when you want a silhouette with both front-facing and grazing angles.
If the preview turns black, check the Fragment connection first. Then look for a missing input, an incompatible socket or a compiler diagnostic on the canvas.
A larger example: Hologram
The Hologram example combines animated scanlines, Fresnel edge lighting, a tinted core, emission and transparency. None of the branches is especially complicated; the effect comes from combining several small signals that each have a clear job.
Use the graph defaults as a baseline: Scanline Speed 3.0, Scanline Density 110, Rim Sharpness 3.5, Beam Sharpness 5.0, Core Intensity 0.25 and Glass Transparency 0.18. Change one parameter at a time: density changes the band spacing, rim sharpness tightens the edge glow, beam sharpness makes the lines crisper and transparency controls how much of the base material remains visible.
Hologram
Editable Hologram graph: inspect the scanline, Fresnel, noise and emission branches, then tune one parameter at a time.
The important part is not copying this exact graph. It is learning to separate an effect into readable branches, validate each branch in the preview and only then combine them.
Saving and persistence
Graphs can currently be saved locally in the browser and loaded again on the same device. The saved document contains the surface mode, nodes, edges and editor version; preview state that can be recreated does not belong in the document.
Uploaded textures are different: they exist only for the active page session. Refreshing the page removes them even if the graph itself was saved locally.
Limits and troubleshooting
The editor currently targets modern browsers with WebGL support. It is designed for learning and iteration, so it does not yet export a Unity material or guarantee identical output across every GPU.
If a graph does not behave as expected, reduce it to the smallest visible chain, confirm the Fragment output, then reconnect one branch at a time. For a missing texture, re-upload it; for a slow preview, lower noise density and remove unnecessary branches before tuning the final look.
What’s next
The next major step is proper user persistence: saving graphs to an account, storing textures permanently and returning to the same graph later. Public graph URLs would then make it possible to share the exact material state with another reader.
Open graph → Save a copy → Modify it → Share your versionMore nodes, stronger diagnostics, additional preview options and reusable examples can follow without changing the core idea: every tutorial should leave you with something you can open and change.
Try it yourself
Open the Hologram graph above or launch the full Shader Graph sandbox. Change one value, break one connection and rebuild it. That small act of experimentation is the fastest way to understand what each node is actually contributing.
When you find a useful variation, save it locally and keep the graph as a starting point for your own material experiments.